|
Operator Share Of Exposure |
  
|
|
Operator Share Of Exposure |
|
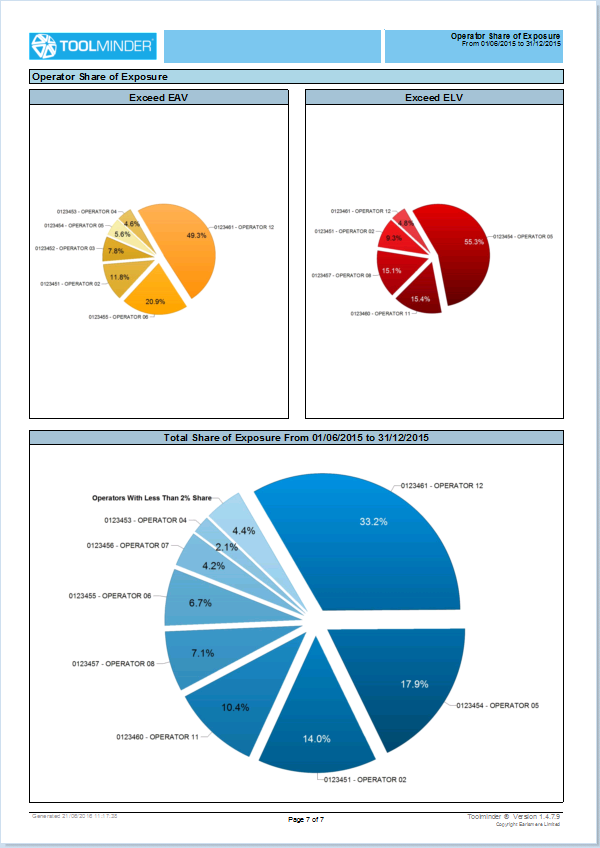
The Operator Share of Exposure chart breaks down the share of exposure for each department, if departments are configured in Toolminder and shows exposure for all operators.
| • | Exceed EAV chart shows the exposure where EAV was exceeded by the operators with the greatest exposure. Note this only includes days where the EAV limit was reached, and does not include exposure when ELV was also reached. |
| • | Exceed ELV chart shows the exposure where ELV was exceeded by the the operators. |
| • | Total Share of Exposure chart highlights the operators with the greatest exposure. |
When viewing this report you need to be mindful that Operators with the greatest overall exposure may not be the one's regularly exceeding their EAV or ELV limits.
To view sample report click here