|
Operator Exposure |
  
|
|
Operator Exposure |
|
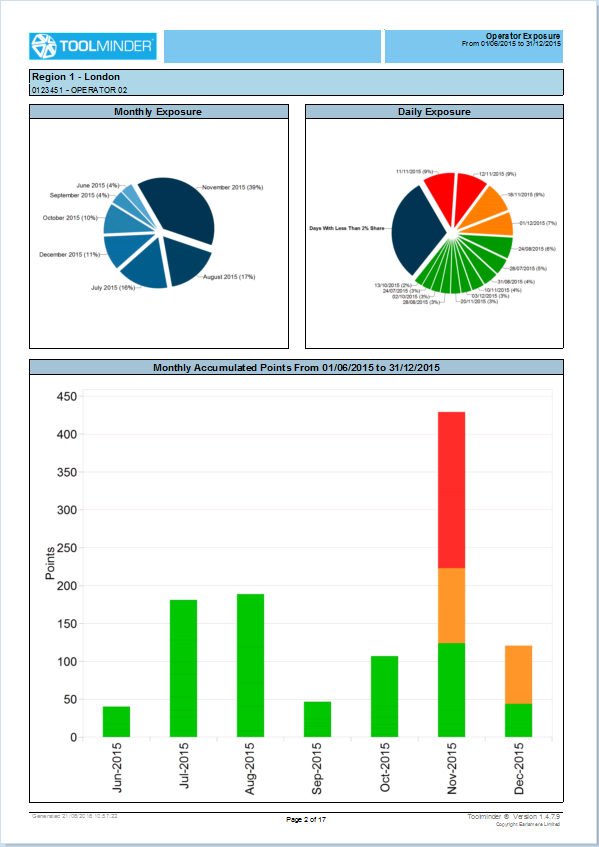
The Operator Exposure chart shows the monthly and daily exposure for each operator.
| • | Monthly Exposure breaks down the total exposure for the operator to show the percentage exposure for each month. |
| • | Daily Exposure break downs the total exposure to individual days, showing the days with the greatest percentage of exposure. |
| • | Monthly Accumulated Points shows the total points of exposure per month for the operator. |
Daily and Monthly Accumulated Points charts show exposure using Red when ELV was exceeded, Amber when EAV exceeded and Green when below EAV.
To view sample report click here